Arizona produces 12% of the nation’s fruits and vegetables – third in the country – yet one in every seven Arizonans struggles with food insecurity, which is the occasional or constant lack of access to food.
Many in Arizona are just one job loss or medical crisis away from food insecurity. But some among us – especially children, seniors, and rural Arizonans – are at greater risk.
Food Security vs. Food Insecurity
“Food security” means that every member of a household has access, at all times, to enough food for an active, healthy life. At a minimum, food security includes:
Ready availability of healthy, safe, nutritious foods.
The ability to get this food in socially acceptable ways (that is, without resorting to emergency food supplies, scavenging, stealing, or other coping strategies).
“Food insecurity” means that some or all members of the household have limited or uncertain access to healthy, safe, nutritious foods, or an inability to acquire these foods in socially acceptable ways.
*Definitions are from the Life Sciences Research Office, S.A. Andersen, ed., “Core Indicators of Nutritional State for Difficult to Sample Populations,” The Journal of Nutrition 120:1557S-1600S, 1990.
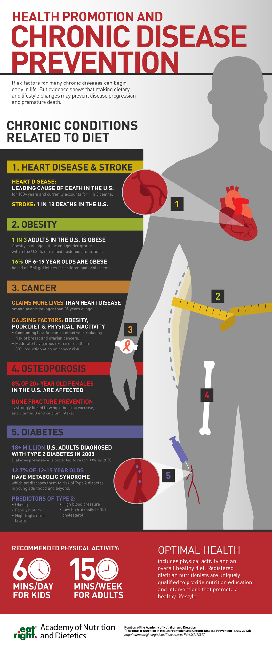
The impact of hunger
Hunger is a Health Problem
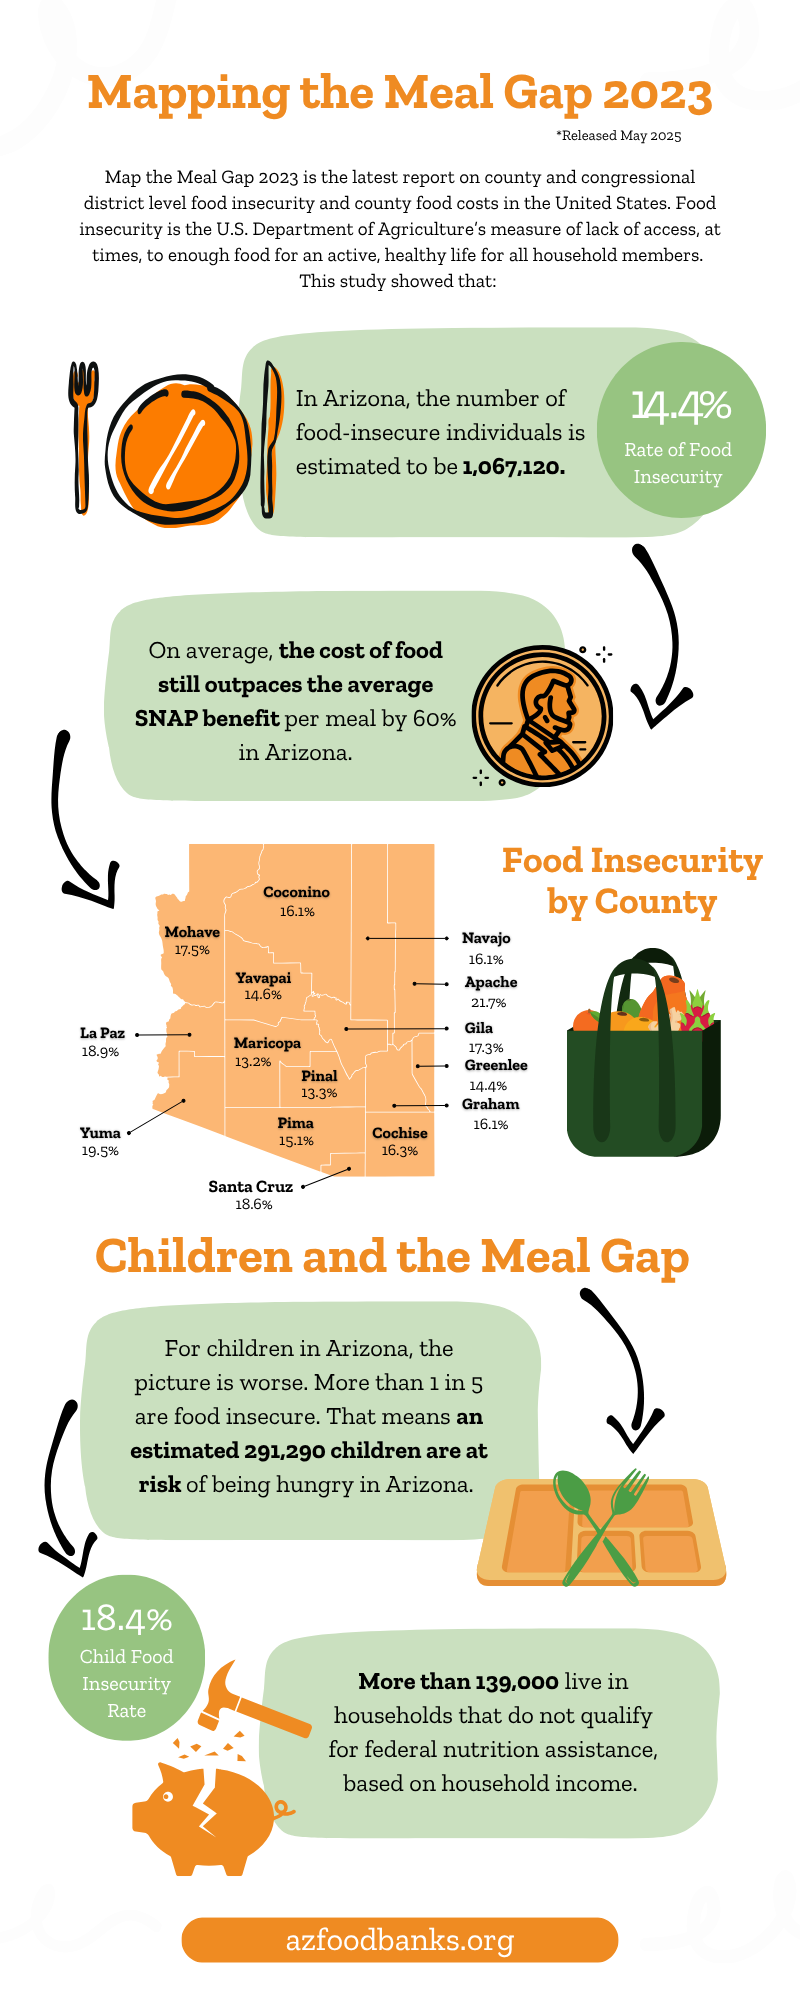
0 in 7
One in seven Arizonans
Face food insecurity
0,067,120
People
Face food insecurity
0,290
Children
Face food insecurity
Without the means to purchase healthy foods, many Arizona families are faced with tough choices about how to access the nutritious foods they need to stay healthy. The consequences are bleak.
Nutrition and health
The meal gap in Arizona
What is food insecurity
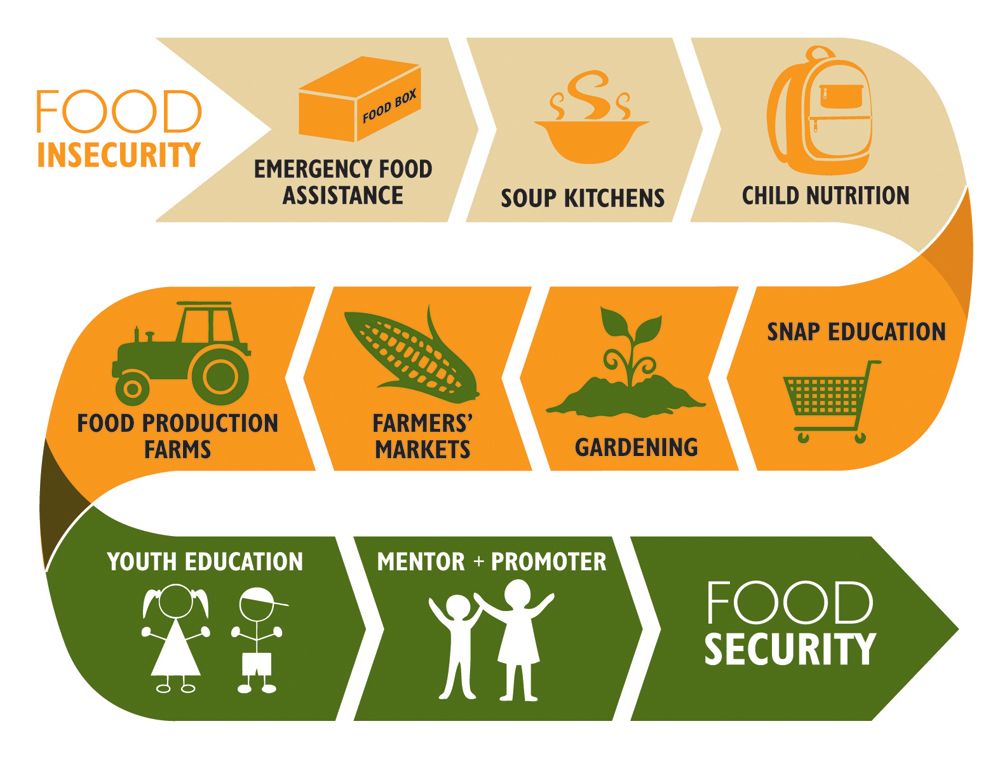
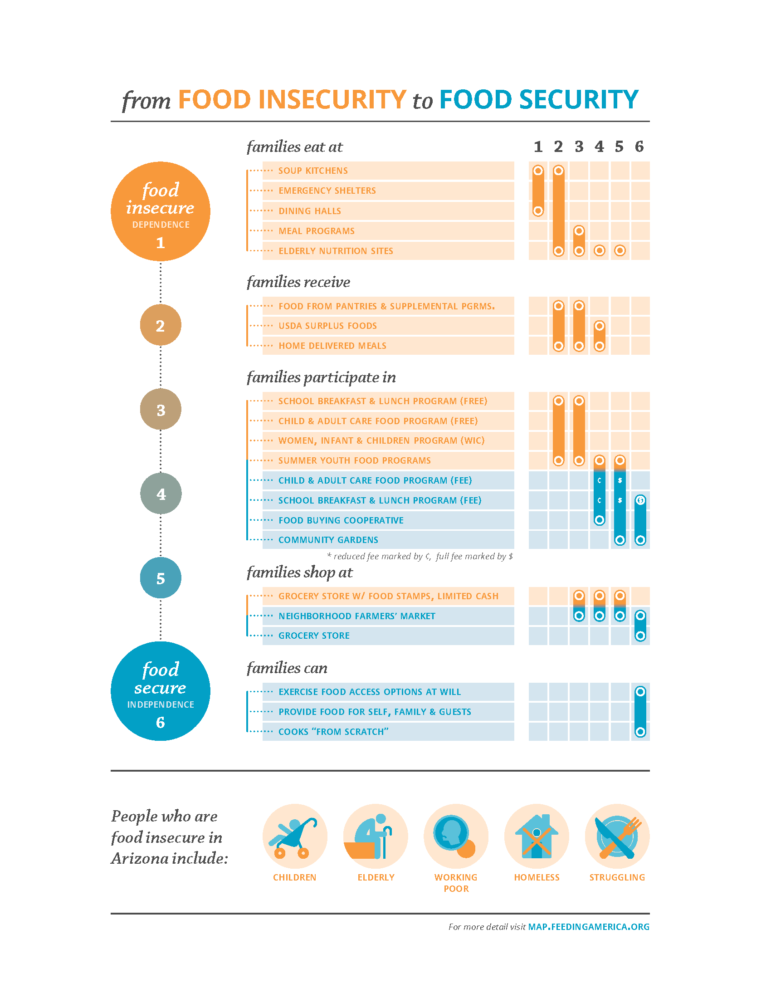
How change happens
From Food Insecurity to Food Security
Hunger fighting programs
How Food and Nutrition Programs help real Arizonans
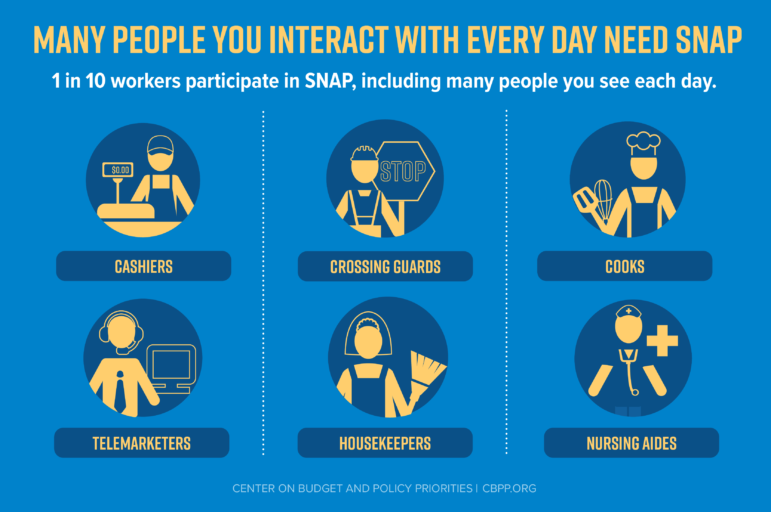
Some Info About SNAP
SNAP, the program that used to be called food stamps, helps millions of people stretch food budgets and adds to economic activity. In Arizona, almost 900,000 benefit from SNAP.
Learning more about hunger
Who gets SNAP? What about other help? What is it like?
Many people in your community rely on SNAP, food banks and school meals. Here are a few of their stories:
That's what we're working on. Whether it's getting people the help they need today, or trying to prevent people from needing emergency help tomorrow, it will take a long time and a lot of will to reach our vision of a hunger free Arizona.